
Enterprise Security user interface
Download and install the CheckPoint SmartConsole Rxx.zz GUI firewall rule set and log reporting application from https://partnergate.sonera.com/enterprisesecurity.html. Behind the link you will also find the installation instructions under Rule and tracking applications installation instructions.
Log-in and use of the user interface view
After the installation is complete, you can log into the reporting view of the SmartEvent application.
Enter the IP address of the SmartEvent server and the username and password you got in connection with the delivery into the SmartEvent login window. The IP address of the SmartEvent user interface can also be found in the connection details listed in SurfManager.
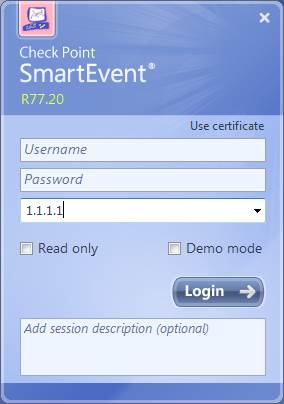
Figure. SmartEvent login.
The overview appears.

Figure. Overview of the reporting application.
The options listed on the top of the SmartEvent are links to the different items (events, timelines, charts, etc.). The items are listed in a table. Click on an item to see item overview and viewing instructions.
Items
1 Overview
When you log in to the service using the SmartEvent application, a threat and event reporting overview opens on the screen.
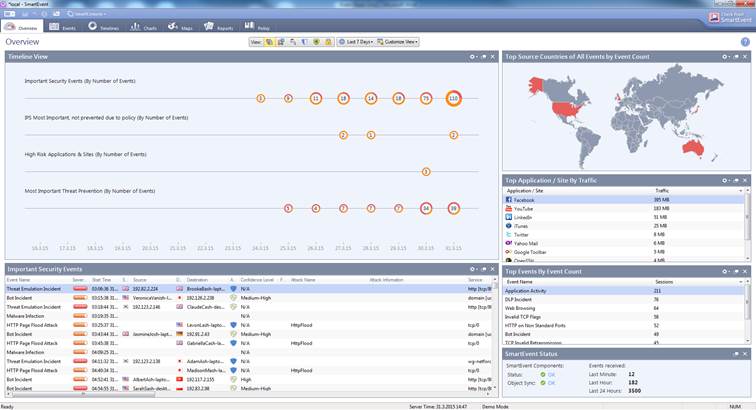
Figure. Threat and event reporting overview.
The Overview tab comprises compilation reports compiled from the events. The menu on top allows you to specify the services on which you want information and to specify the period that the compilation reports should cover.
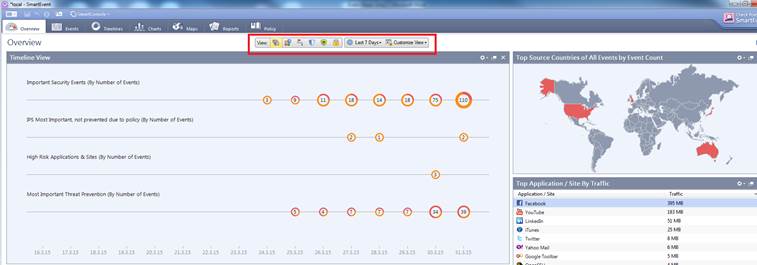
Figure. Service and period selection.
Below you will find a more detailed description of the compilation report content.
Timeline View
The Timeline view shows the events of the period selected in linear form. The number of events refers to the period circled. The colour of the circle indicates the criticality of each event. By double-clicking at the circle you can view the events in greater detail. By clicking at the top right-hand corner you can further specify the matters to be reported.
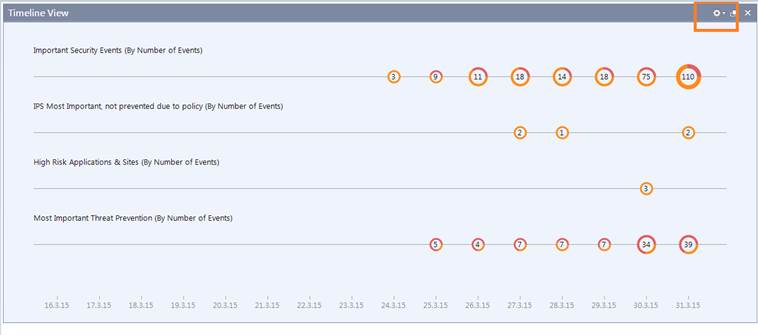
Figure. Timeline view.
Important Security Events
Important Security Events shows the most important security events in the period given. Double-click to view an event in greater detail. By clicking at the top right-hand corner you can further specify the matters to be reported.

Figure. Important Security Events.
Map View
The Maps view shows the source/destination countries that have been the most active as regards the number of events. By clicking at the top right-hand corner you can further specify the matters to be reported.
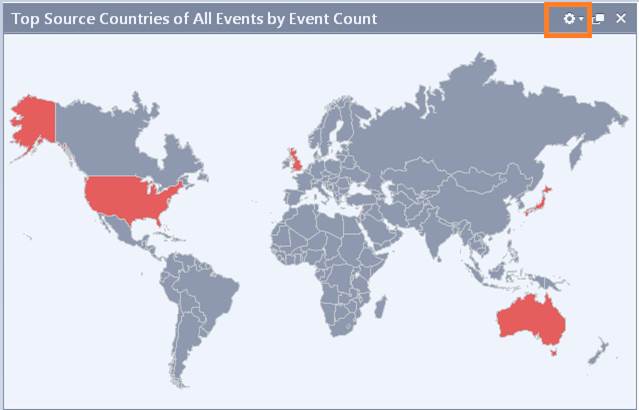
Figure. Maps view.
Top Application / Site by traffic
Top Application / Site by Traffic shows the most frequently used applications. By clicking at the top right-hand corner you can further specify the matters to be reported.
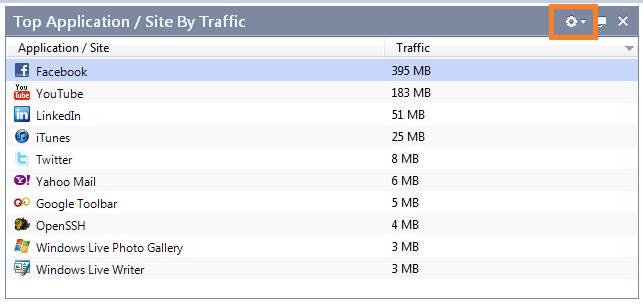
Figure. Top Application / Site by Traffic.
Return to the item selection table.
2 Events
To see the Events view, select the Events tab.
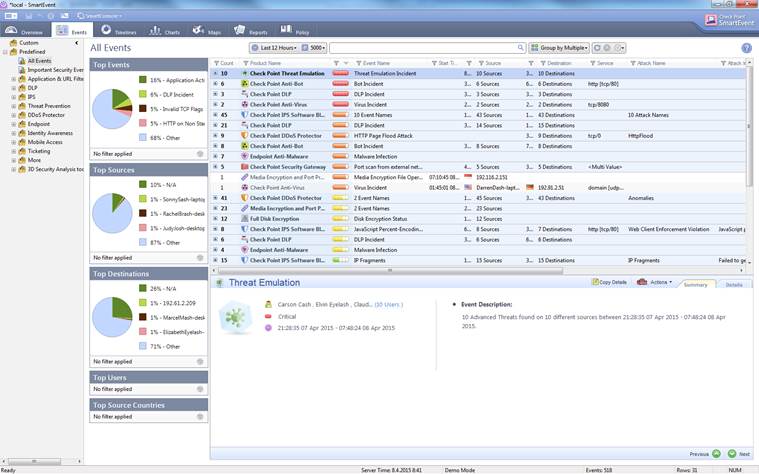
Figure. Events overview.
In the Events view you can view the events in greater detail by selecting All Events, a desired event (Application & URL filtering, etc.) or a Custom search on the left.
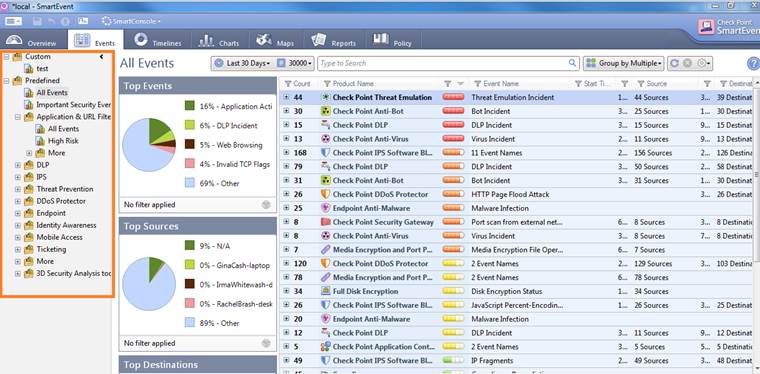
Figure. Events.
Double-click to view Top Events, etc. in greater detail. To go back, select Clear filter at bottom right.
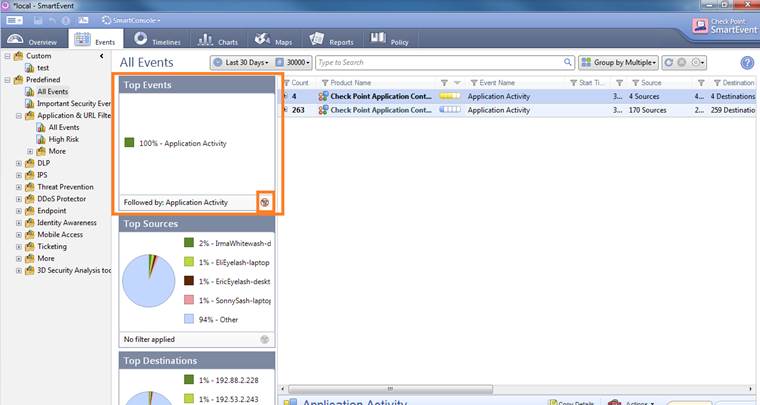
Figure. Top Events in greater detail.
The menu bar on top allows you to filter the events in greater detail for example by changing the period (Last x Days), use Type to Search, change the order of the matters filtered (Group by), and update or clear the search criteria.
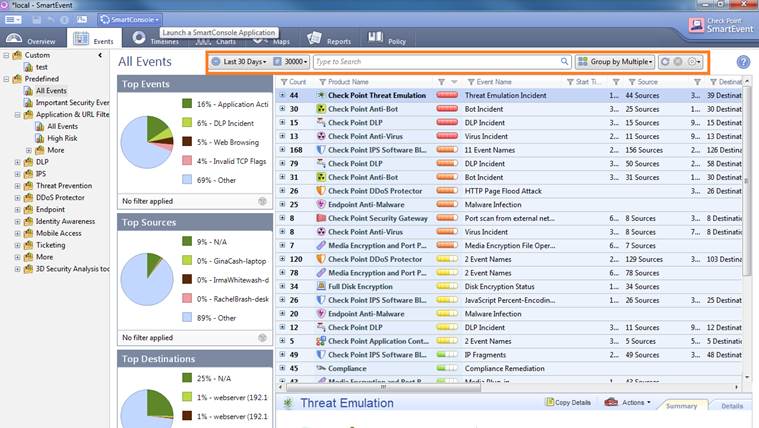
Figure. Event filtering.
Double-click a desired event to view it in greater detail.
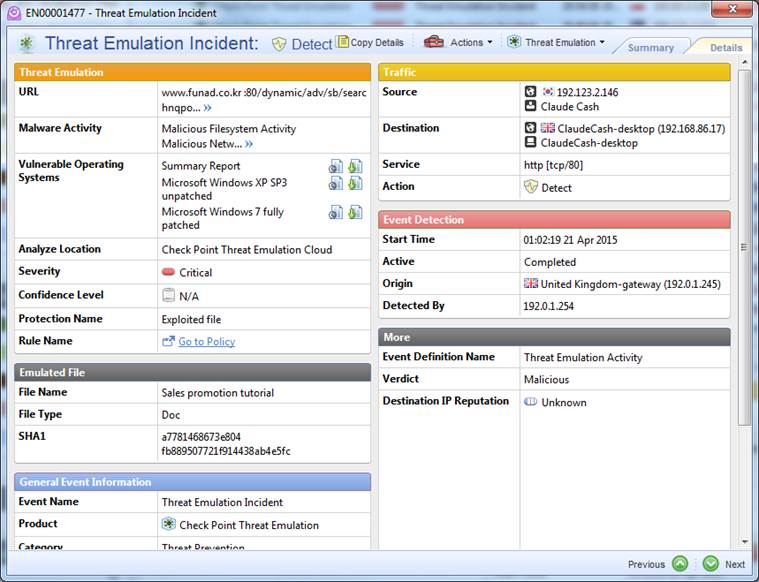
Figure. An individual event in greater detail.
Return to the item selection table.
3 Timeline
The Timeline view opens when you select the Timelines tab.
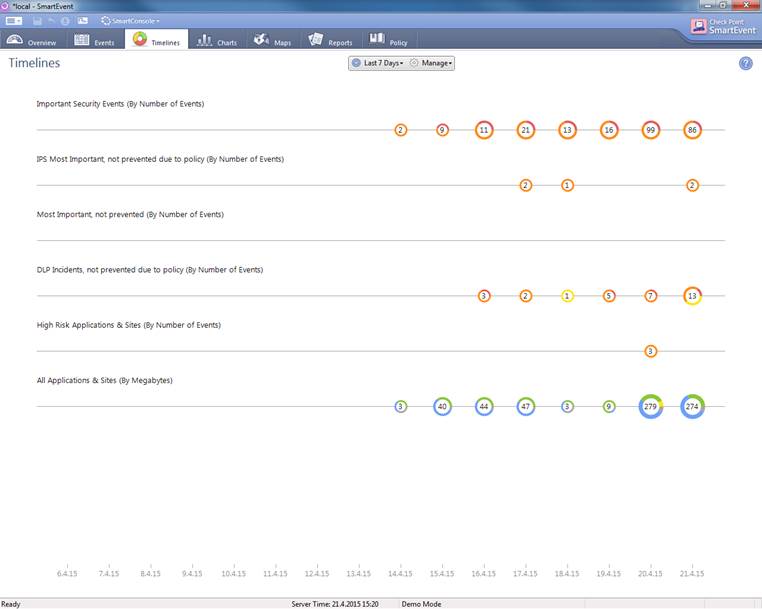
Figure. Timelines overview.
In the Timelines view you can study security events within a certain period: how many events have there been, and how critical have they been. You can add matters to be viewed by selecting Add Line and making the appropriate selections. Double-click the mouse on a circle to view the events of the day in question in greater detail.
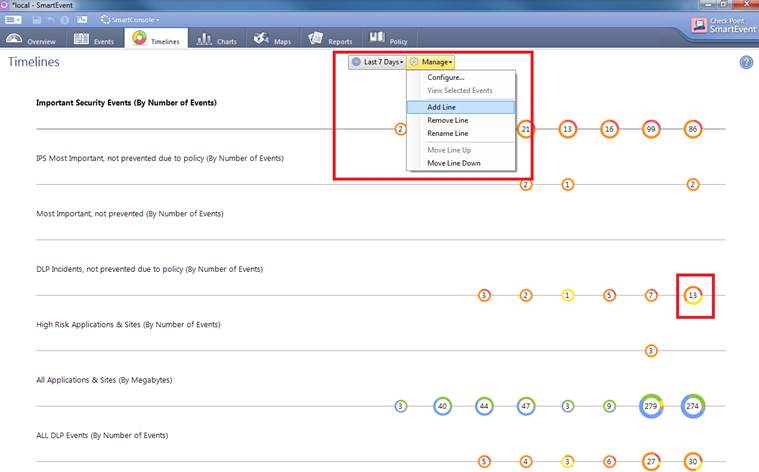
Figure. Adding Timeline definitions and viewing them in greater detail.
Return to the item selection table.
4 Charts
Open the Charts view by selecting the Charts tab.
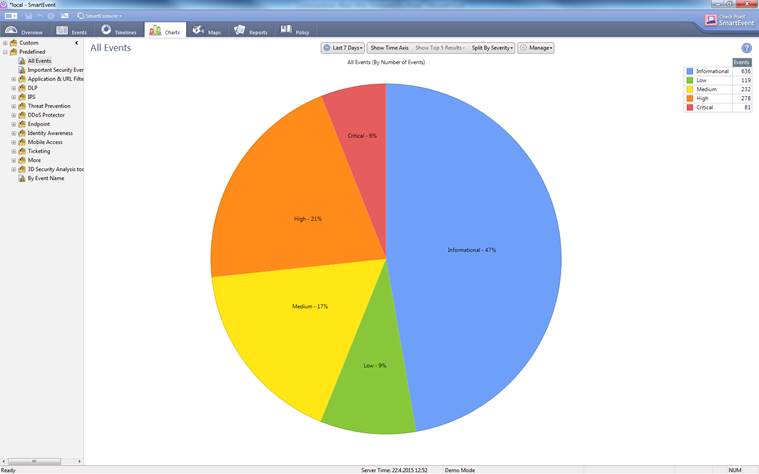
Figure. Charts overview.
In the Charts view you can view the events in greater detail by selecting All Events, a desired event (Application & URL filtering, etc.) or a Custom search on the left. In this view you can specify the period, manner of representation, number and criticality of the events to be reported or the name of an event.
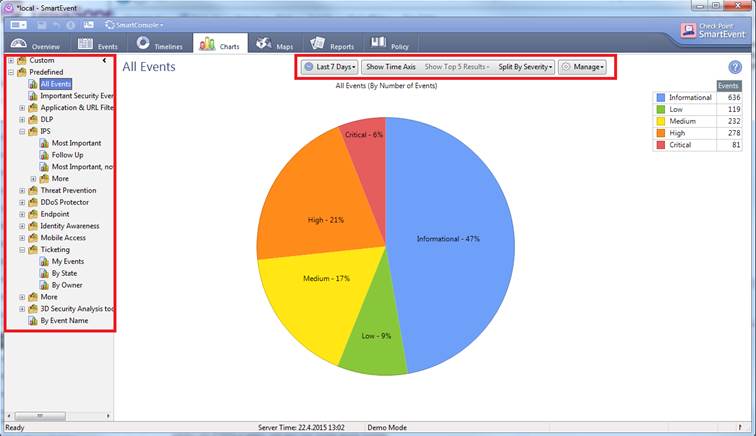
Figure. The Charts view in greater detail.
Return to the item selection table.
5 Maps
To open the Maps view, select the Maps tab.
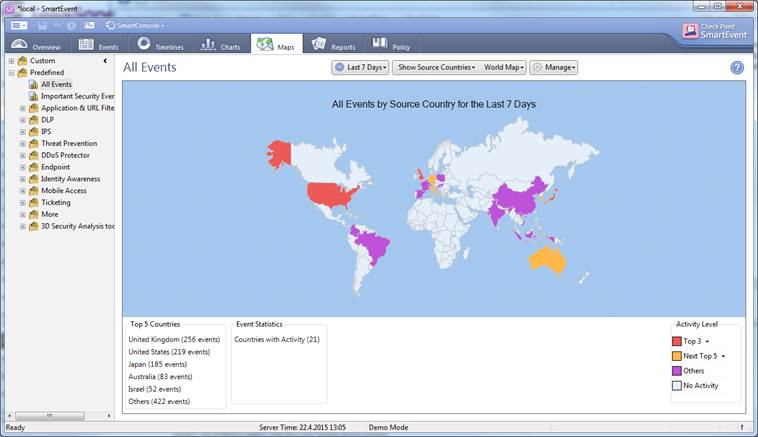
Figure. Maps overview.
In the Maps view you can view the events in greater detail by selecting All Events, a desired event (Application & URL filtering, etc.) or a Custom search on the left. In this view you can specify the period, source or destination countries, continent or the whole world, and set colour codes for Top Events. The number of Top Events by country is shown at bottom left.
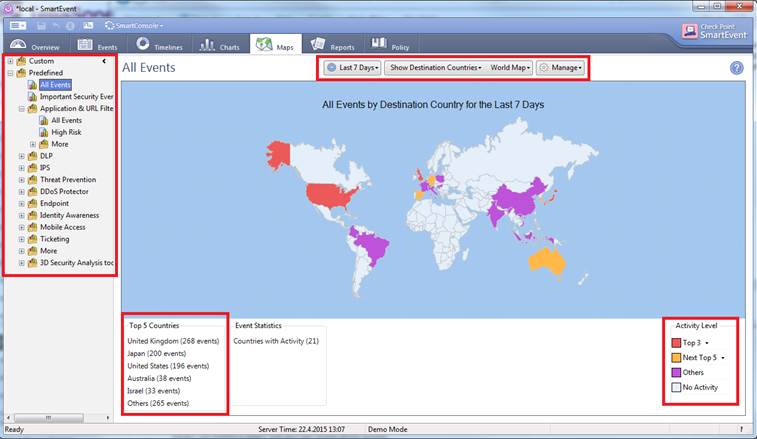
Figure. The Maps view in greater detail.
Return to the item selection table.
6 Reports
To open the Reports view, select the Reports tab. Note: The Reports view is not available in Basic Reporting.
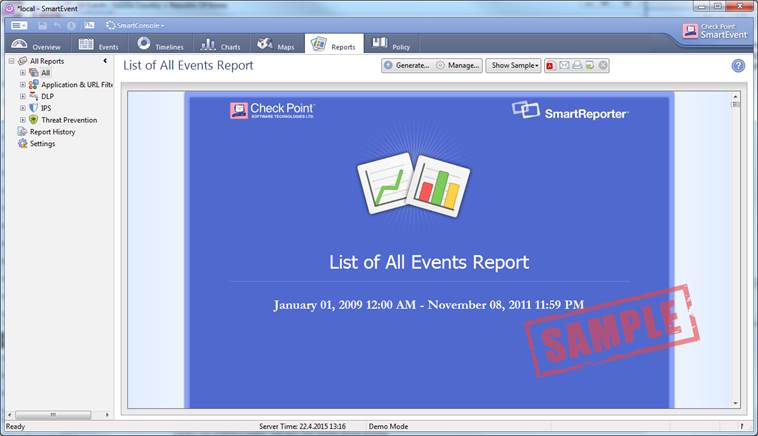
Figure. Reports overview.
In the Reports view you can view the reports in greater detail by selecting List of All Events or a desired event (Application & URL filtering, etc.) on the left. In this view you can specify the period and view a report in the Reports view or send the report in PDF format.
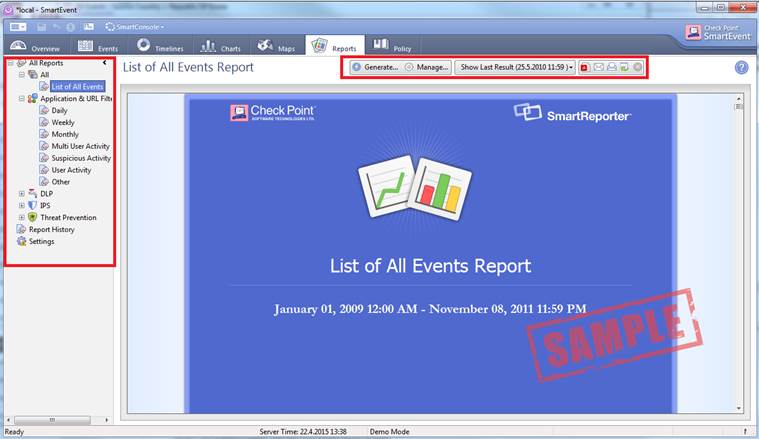
Figure. The Reports view in greater detail.
Return to the item selection table.
7 Policy
The Policy view opens when you select the Policy tab. Note: The Policy view is not available in Basic Reporting.
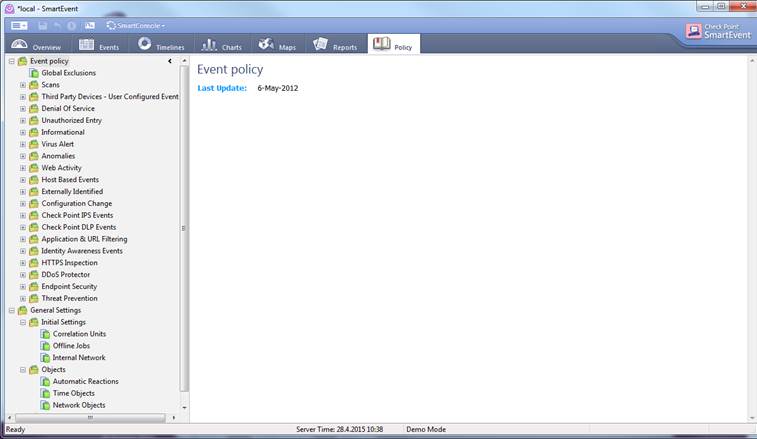
Figure. Policy overview.
In the Policy view you can specify, for example, what events should be reported and what not. For example, you can create a policy specifying that informative events are left out from reports. Below, informative events are left out from reports in application and bandwidth management and web content filtering services.
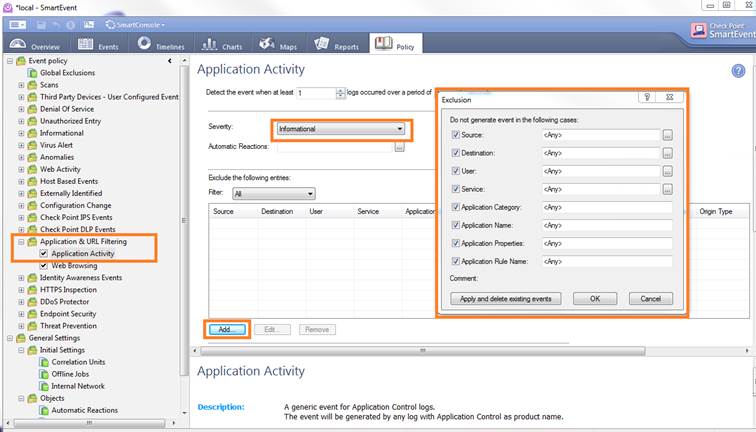
Figure. Adding policy rules.
In the Policy tab you can also set alarms for critical events. For example, you can create a policy specifying that an alarm message should be sent by email to the service administrator whenever a botnet is detected.
Return to the item selection table.